Japanese Candlestick Patterns In Forex Trading
Japanese Candlestick Patterns
• A Brief History of Japanese Candlestick Charting Patterns.
During the 18th century, the Japanese developed candlestick charts to track the market. Rice was used as a means of trade in Japan during this period since there was no clear currency standard in place at the time. Different feudal lords put rice in warehouses in Osaka, where they would later sell or trade the coupon receipts, resulting in rice becoming the world's first futures market. Homma Munehisa, a great Japanese rice trader who lived in the 1700s, researched every element of rice dealing, from the fundamentals to the psychology of the market.
Homma went on to become the dominant player in the Japanese rice markets, amassing an enormous wealth. Eventually, his trading strategies and concepts developed into the candlestick system, which was later adopted by Japanese technical analysts when the Japanese stock market was established in the 1870s. The approach was developed by renowned market expert Charles Dow about 1900, and it is still likely the most prominent kind of technical analysis chart used by traders of financial instruments today, according to certain estimates.
• Why use Candlestick Charts?
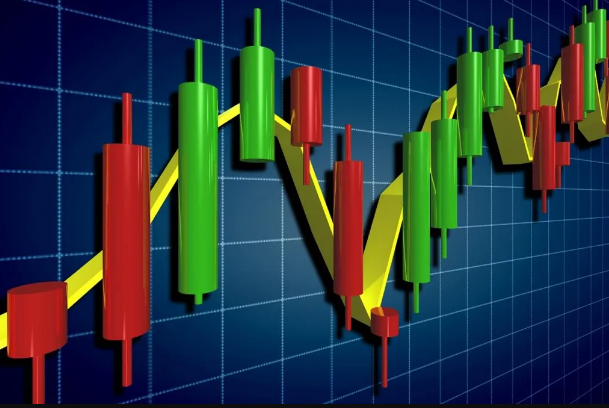
Essentially, candlestick charts display the same information as bar charts, but they do it in a more thorough and precise manner, allowing for more accurate analysis of market movement.
Using candlestick charts, you can see how the supply and demand situation is changing by seeing who is winning the bullish and bearish struggle between the bulls and bears.
Candlestick charts provide additional dimension to the price action of a specific time by depicting the power (or lack thereof) behind each price bar's movement in a visual manner.
In real time, candlestick formations make it substantially simpler to identify all single bar and multi-bar patterns, enhancing your chances of spotting high probability trade setups. Furthermore, since candlestick charts employ the same data as bar charts (open, high, low, and close), any Western technical signals that can be applied to a bar chart can also be applied to a candlestick chart with relative ease.
Candlestick charts provide everything that bar charts provide, plus more. Using candlestick charts is a win-win scenario since you can utilize all of the trading indications that you would typically use on bar charts, but with the increased clarity and additional signals given by candlestick charts.
Charts with candlesticks are more visually appealing.
• The Anatomy of a Candle
Candlesticks feature a center part that depicts the difference in price between the start and closing of the day's trading session. The real body, often known as the body, is the location where the actual body is located.
The price gap between the open and the high during the period under consideration is referred to as the upper shadow, which is also referred to as a "upper wick" in certain instances. The greatest price paid for a certain time is represented by the peak of the top shadow.
The price gap between the close and the low during the period under consideration is referred to as the lower shadow, which is also referred to as a "lower wick" in certain cases.
The true body of the chart depicts the opening and closing prices of the security that is now being traded in real time. Closing prices are very important since they decide whether or not the bulls or bears are still in the game. Alternatively, if the security closed at a greater price than it opened, the actual body is white or unfilled, with the opening price located at the very bottom of the real body and the closing price located at the very top of it. Alternatively, if the security closed at a lower price than it opened at, the true body is black, with both the starting price at the top and the closing price at the bottom of the chart. A candlestick's body and wick may or may not be present depending on the price activity during the time period under consideration.
Modern candlestick charts (particularly those presented digitally) sometimes substitute the black or white of the candlestick true body with colors such as red (for a lower closing) and blue or green (for a higher close) in order to better emphasize or visualize price fluctuations (for a higher closing).
• Core Candlestick Patterns
It is possible to employ a variety of candlestick patterns; here is a quick summary of the most popular and extensively used single and multi-bar designs that can be found on the market today.
Bullish Candle
Signals uptrend movement, they occur in different lengths; the longer the body, the more significant the price increase
Bearish Candle
Signals downtrend movement, they occur in different lengths; the longer the body, the more significant the price decrease.
Long Lower Shadow
These candles provide a bullish signal, the lower shadow must be at least the size of the real body; the longer the lower shadow the more reliable the signal.
Long upper shadow
These candles provide a bearish signal, the upper shadow must be at least the size of the real body; the longer the upper shadow the more reliable the signal.
Hammer
The hammer is a bullish signal that occurs during a downtrend. The lower shadow should be at least twice the length of the real-body. Hammers have little or no upper shadow. When a hammer occurs during an uptrend it is known as a “hanging man” and is a bearish signal. Because of the bullish long lower shadow however, this pattern needs bearish confirmation by a close under the hanging man’s real body.
Shooting Star
This candle has a long upper shadow with little, or no lower shadow, and a small real body near the lows of the session that develops during or after and uptrend.
Harami
The Harami is a two-candlestick pattern in which a small real body forms within the prior session’s larger real body.
Doji
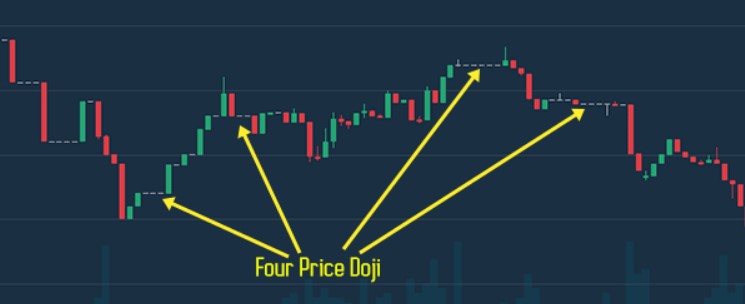
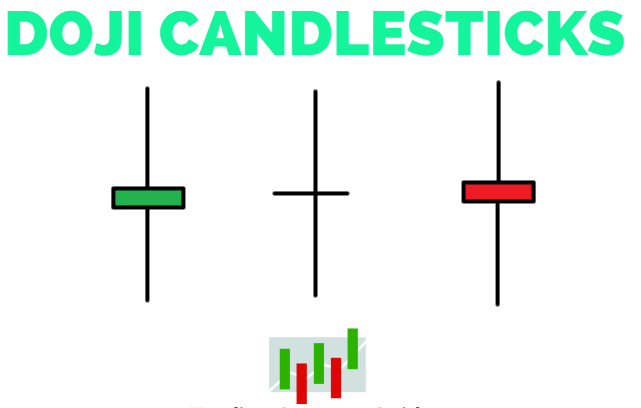
The Doji is a candlestick in which the session’s open and close are the same, or almost the same. There are a few different varieties of Dojis, depending on where the opening and closing are in relation to the bar’s range.
Dragonfly doji
The Dragonfly Doji has a long lower shadow, the open, high, and close are at or very near the session’s high. This pattern often signals reversal of downtrend.
Gravestone doji
The Gravestone Doji has a long upper shadow, the open, low, and close are at or very near the session’s low. This pattern often signals reversal of an uptrend.
High wave candle / long-legged doji
This candle has a very long upper or lower shadow and a small real body. If the opening and closing price are the same the candle has no real body and is then called a Long-Legged Doji. The first picture is a high wave candle the second is a Long-Legged Doji.
Engulfing candles
The bullish engulfing pattern consists of large white real body that engulfs a small black real body in a downtrend. The bearish engulfing pattern occurs when the bears overwhelm the bulls and is reflected by a long black real body engulfing a small white real body in an uptrend.
Spinning tops
Spinning tops are simply candles with small real bodies.
How Candlestick patterns translate into Nial Fuller’s Price Action Setups
My favorite price action settings are the pin bar, the inner bar, and my patented fakey arrangement, which are all variations of the pin bar. The candlestick patterns shown above may easily be reduced down to one of my three price action settings, or they may be relevant to more than one of my price action setups, depending on the situation. It might be tough to keep track of all of the many types of candlestick patterns that exist. This is why I believe that my three primary price action setups do an excellent job of integrating all of the relative candlestick patterns while also making them simpler to interpret in the context of daily price movement. Allow me to demonstrate some of the numerous candlestick patterns that may be transformed into my price action setups by looking at some of the charts below.
Pin Bars
The pin bar can include the following previously described candlestick patterns; long lower shadow candles and long upper shadow candles, hammers and shooting stars, dragonfly and gravestone dojis.
Inside Bars
The term "inside bar" refers to any candlestick pattern that is comprised of at least two candlesticks in which the first candlestick completely engulfs the entire range of the subsequent candlestick. However, spinning tops and dojis are the patterns that are most commonly associated with inside bars. It is important to note that the inner bar differs from the "engulfing pattern" in that it encompasses the complete range of the bar, from high to low, while the engulfing pattern just includes engulfment of the candle's true body. My preference is to trade within bars in the context of a strongly moving market, since they are often excellent entry opportunities into trending market conditions. Inside bars, on the other hand, are often seen during important market turning moments, as well as when the preceding trend loses speed, stops, and forms an inside bar, before changing course.
The Fakey Setup
My fakey setup is simply a multi-bar pattern that comprises of a false break from an inner bar pattern or a key level, combined with a false break from an outside bar pattern. It is possible to create a variety of various candlestick patterns with the fakey. It is also uncommon for a fakey setup to consist of a bullish or bearish engulfing pattern that is entirely enveloping the range of a spinning top or doji candle, which results in the formation of a false break bar in the shape of any of the candlesticks listed above that qualify as pin bars.
In Conclusion
Candlestick charts give a more vivid portrayal of market activity than a normal bar chart, which is advantageous in certain situations. Candlestick patterns are valuable in and of themselves, but there are many various names and interpretations of candlestick patterns, which may cause confusion and make it difficult to keep track of them all. In my price action training material, you will see that I have condensed all of the essential candlestick patterns into three simple yet extremely successful price action setups. To me, trading candlestick patterns using my own thoughts on price action trading is a far more efficient, straightforward, and successful approach to trade than traditional candlestick patterns, and I believe that after studying my forex trading course, you will feel the same way.
